Research
COVID-19, 2021
COVID-19 and Minimizing Micro-Spatial Interactions
Abstract
COVID-19, the novel coronavirus that has disrupted lives around the world, continues to challenge how humans interact in public and shared environments. Repopulating the micro-spatial setting of an office building, with virus spread and transmission mitigation measures, is critical for a return to normalcy. Advice from public health experts, such as maintaining physical distancing from others and well-ventilated spaces, are essential, yet there is a lack of sound guidance on configuring office usage that allows for a safe return of workers. This paper highlights the potential for decision- making and planning insights through location analytics, particularly within an office setting. Proposed is a spatial analytic framework addressing the need for physical distancing and limiting worker interaction, supported by geographic information systems, network science and spatial optimization. The developed modeling approach addresses dispersion of assigned office spaces as well as associated movement within the office environment. This can be used to support the design and utilization of offices in a manner that minimizes the risk of COVID-19 transmission. Our proposed model produces two main findings: 1) that the consideration of minimizing potential interaction as an objective has implications for the safety of work environments and 2) that current social distancing measures may be inadequate within office settings. Our results show that leveraging exploratory spatial data analyses through the integration of geographic information systems, network science and spatial optimization enables the identification of workspace allocation alternatives in support of office repopulation efforts.
Link to article forthcoming.
Urban Mobility, 2021
Urban Mobility and Segregation Examined through Networked Travel Activity
Abstract
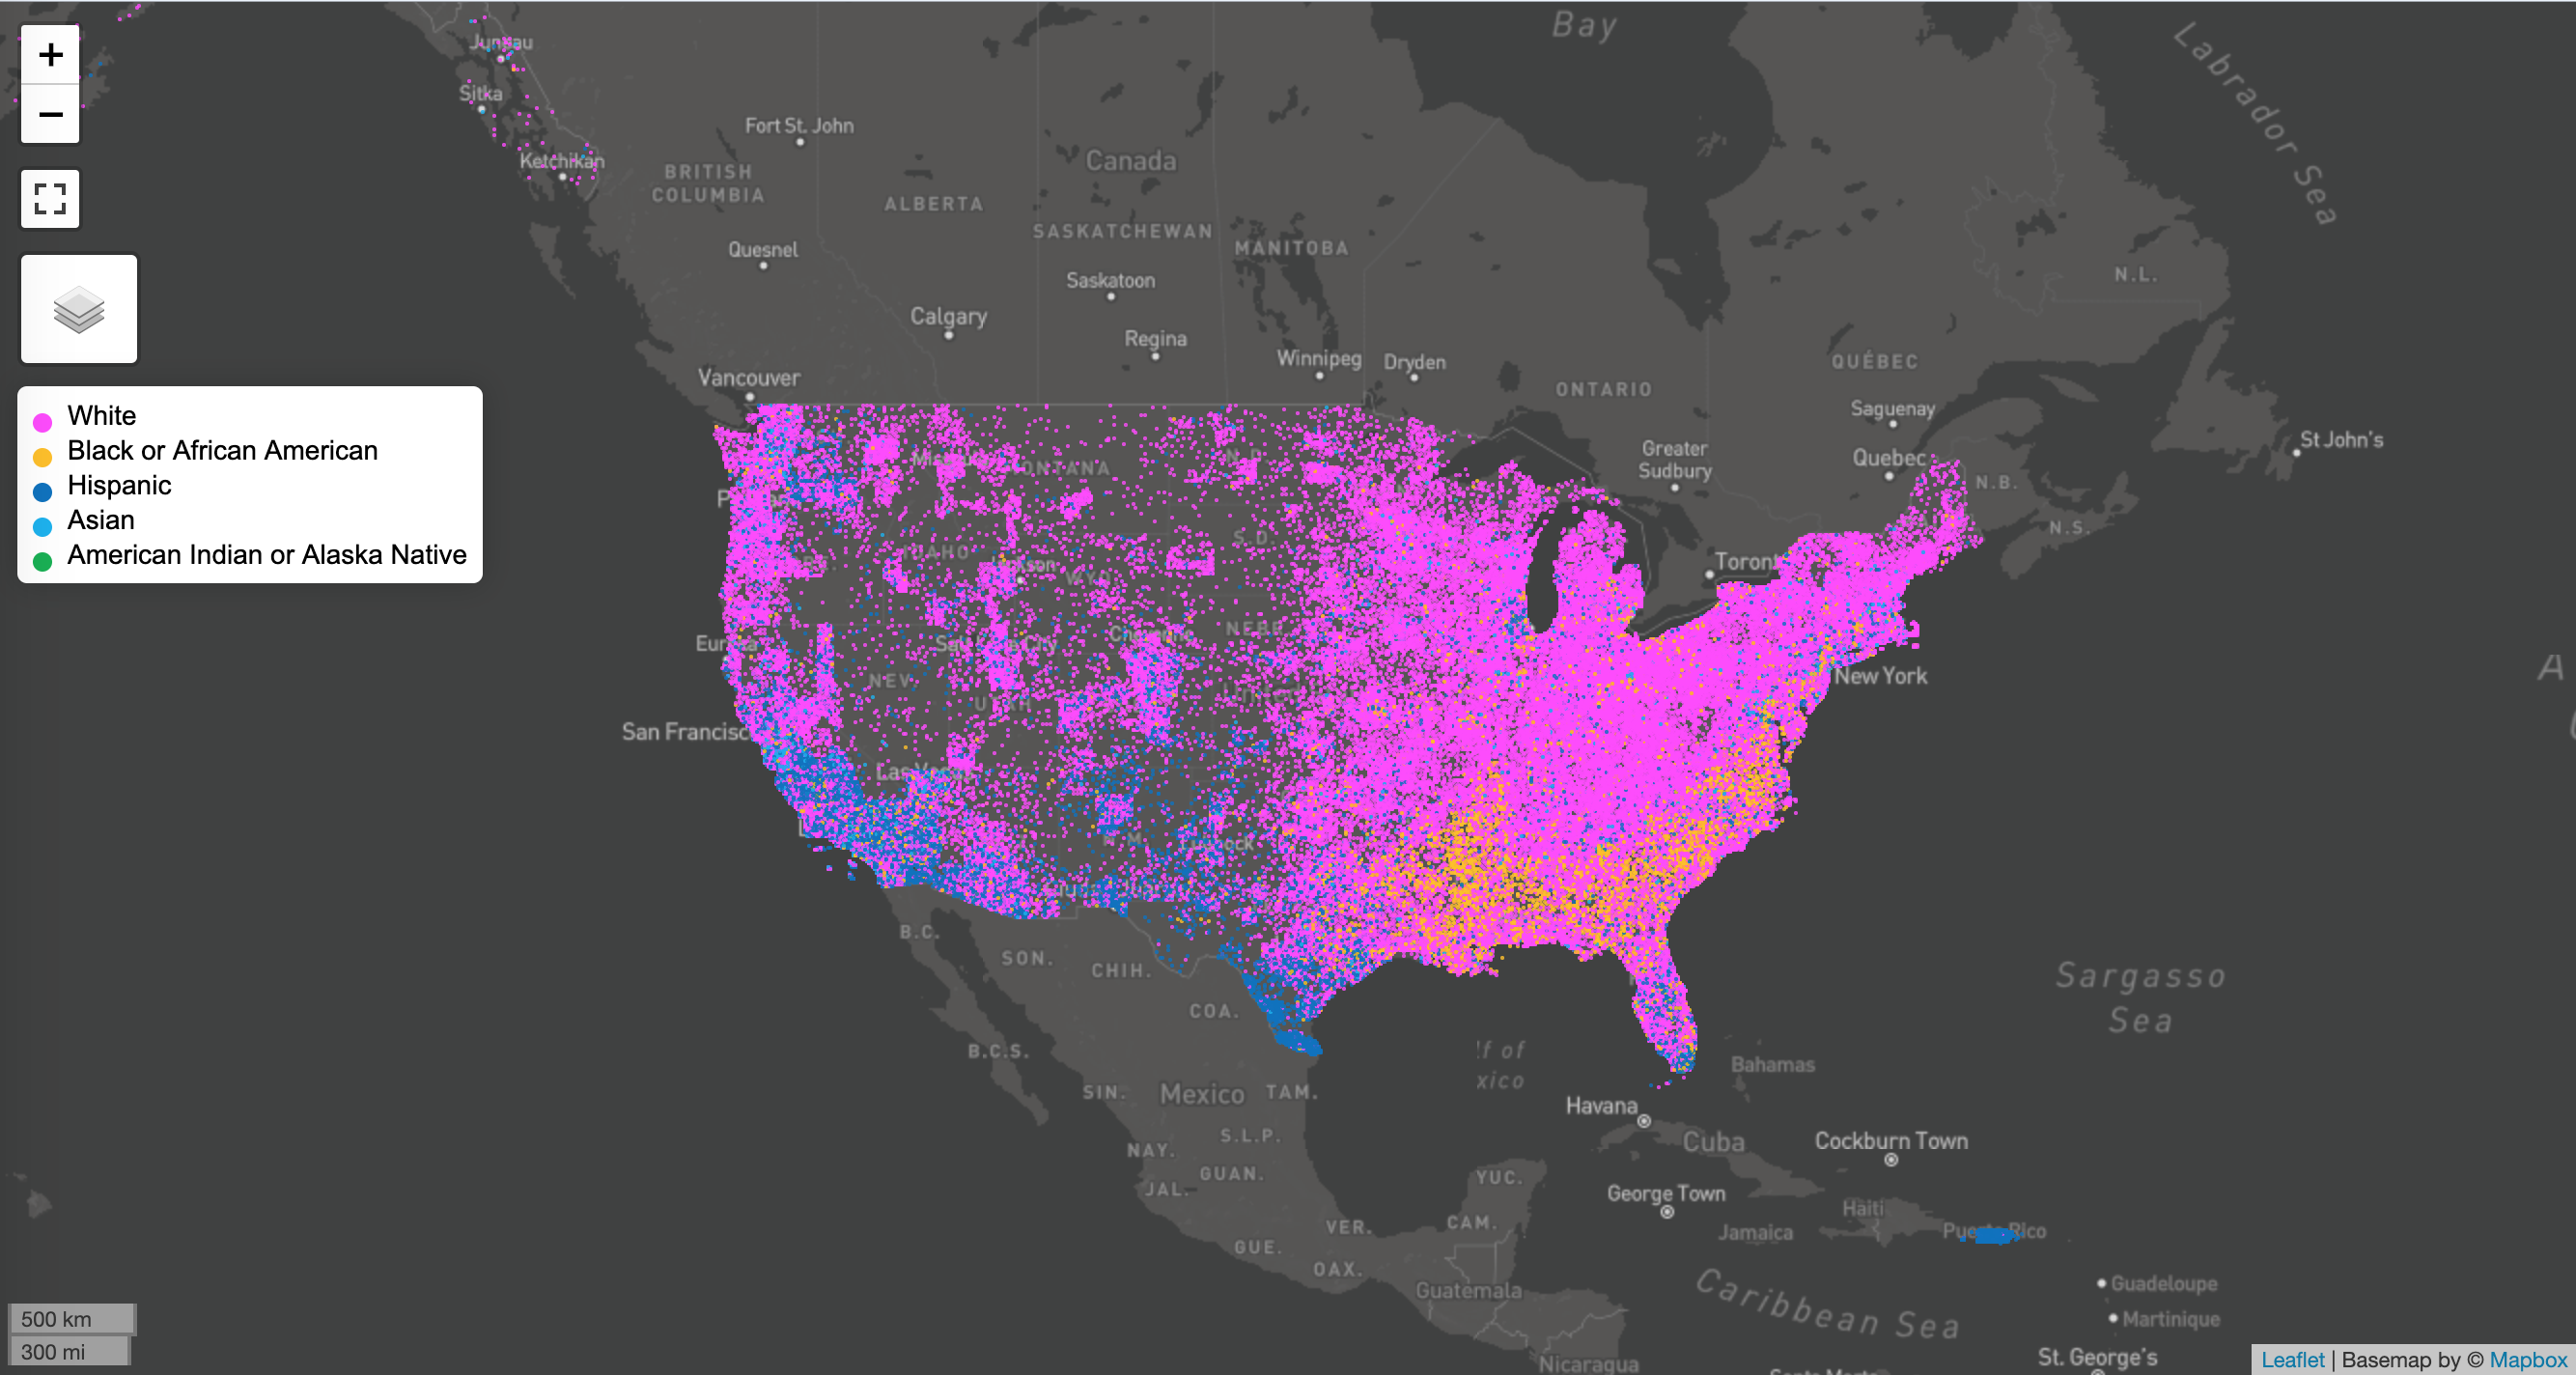
Individuals make travel decisions every day that feed into a vast network of spatial interactions. Unfortunately for some, ongoing economic, social and psychological effects related to the United States’ history of racism, segregation, and discrimination have led to significant disparities in urban mobility across racial groups (Ray and Preston 2009). The effect of segregation in residential neighborhoods has been extensively studied, and more attention is being brought to other spatial contexts in which people interact. However, comparatively little research has taken a comprehensive approach to both segregation and urban mobility by analyzing residential, work and social environments together. The utility of this approach lies in the ability to characterize physical spaces by their potential for interaction between racial groups, and whether or not group networks of activity reveal the different accessibility levels of neighborhoods in an area. This chapter seeks to address how networks and associated metrics can help to explain broad urban mobility patterns and the differences that exist between racial groups. In order to model urban mobility, we first construct networks of travel activity based on race. We then derive various network-based measures and a neighborhood-interaction potential matrix that compares travel between neighborhoods in our study area. We present results for the Los Angeles and Orange County area as a case study because it has a large, diverse population and continues to be a focus of segregation research (Johnston et al. 2006).
Link to book chapter here.
WE1S, 2020
The WhatEvery1Says Project
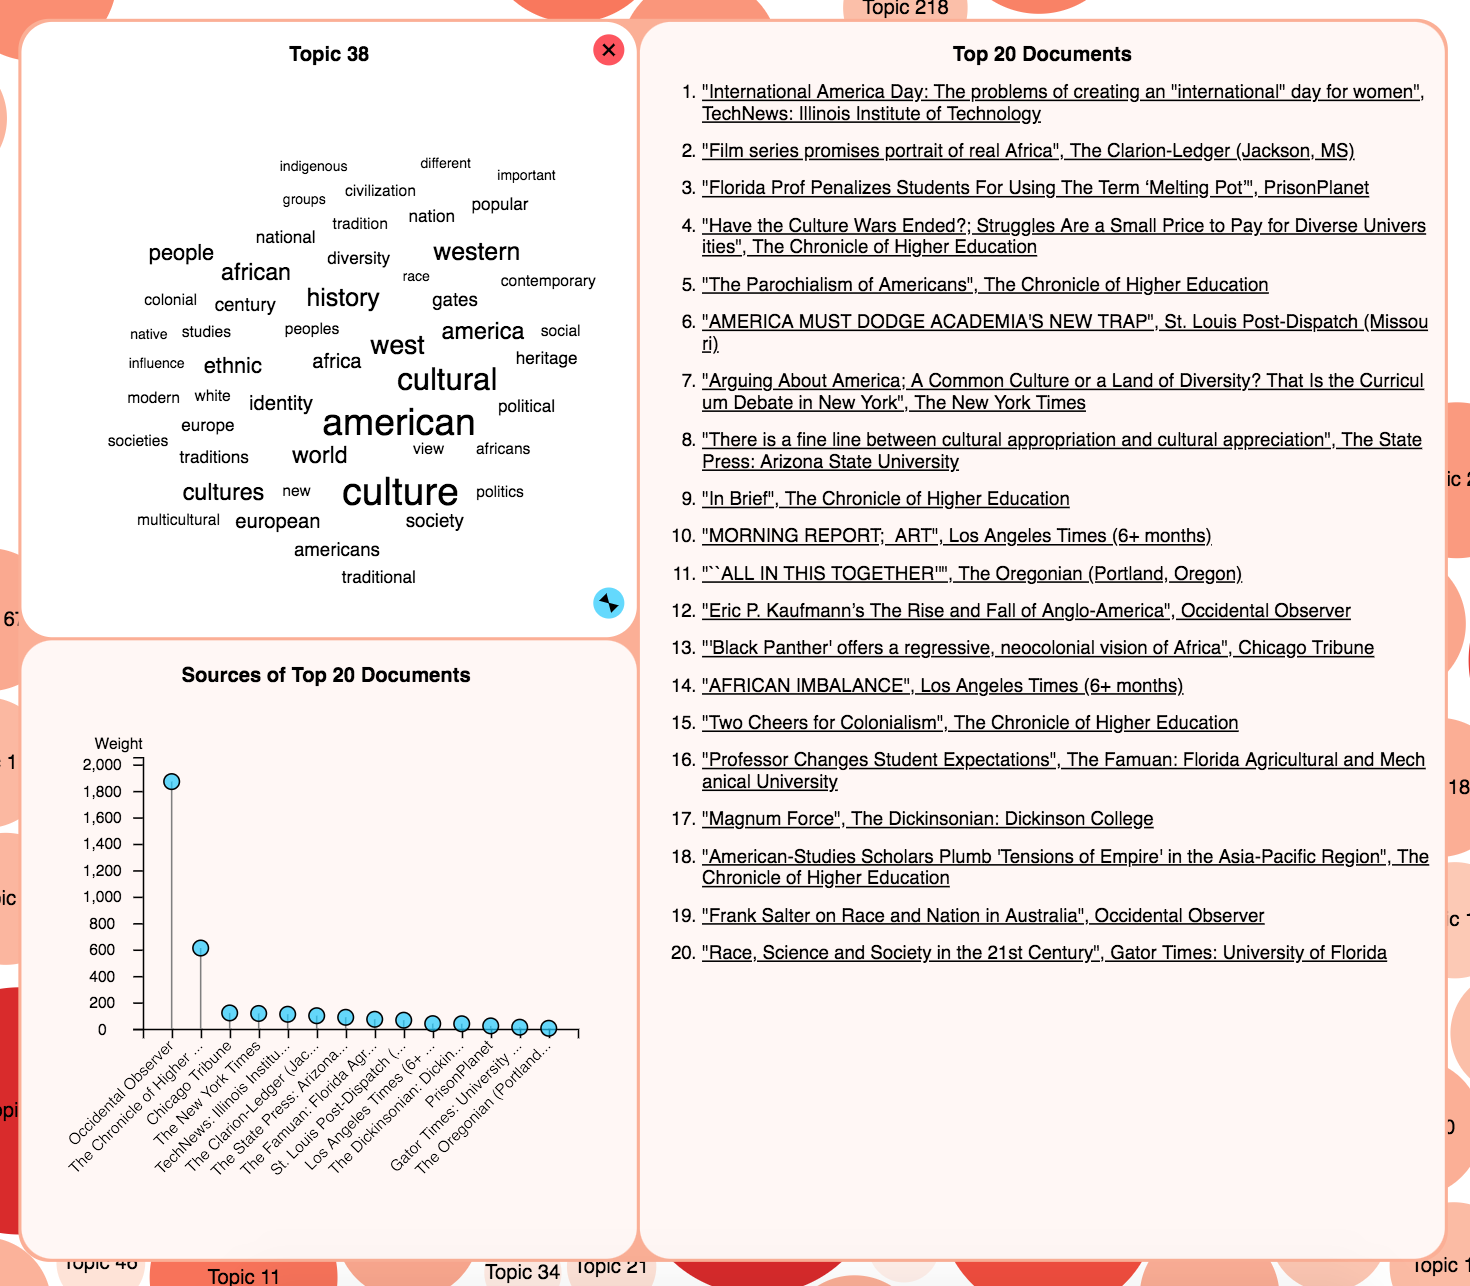
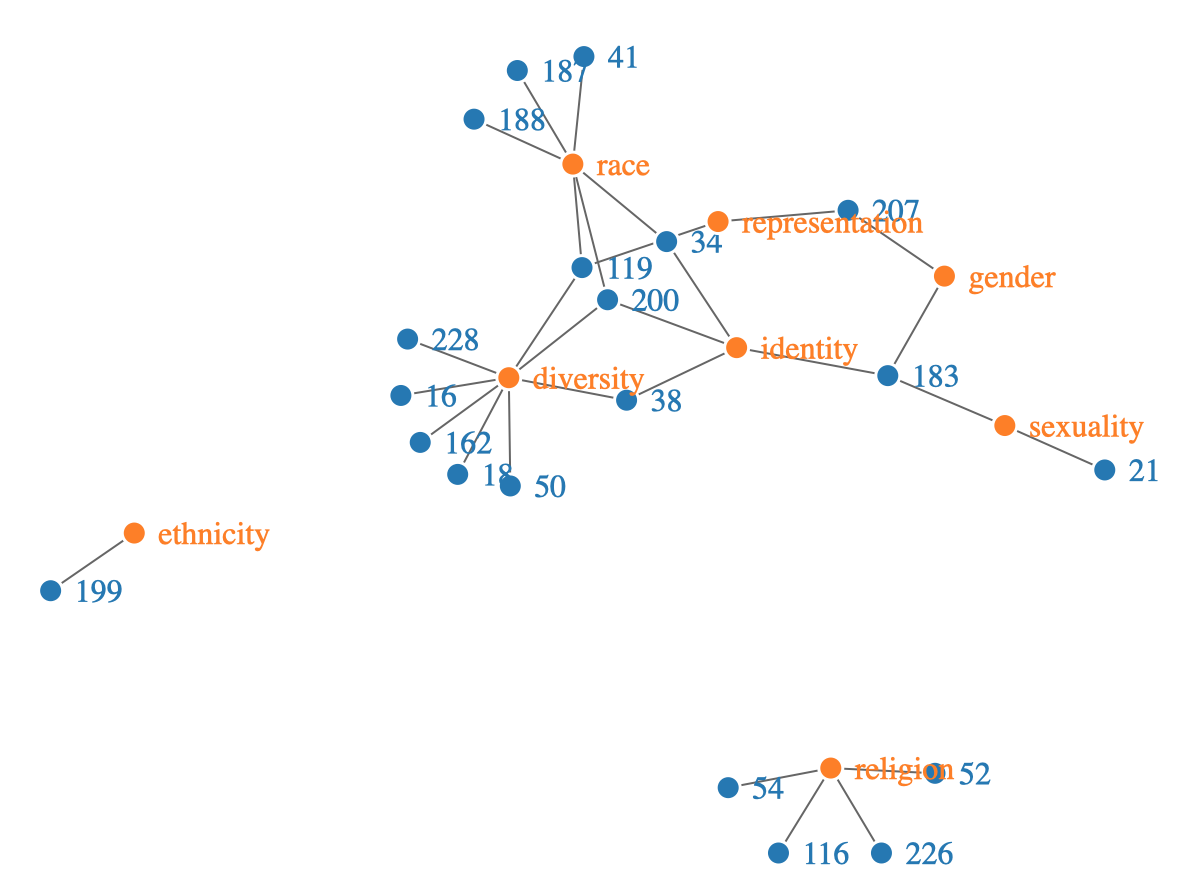
I was fortunate enough to serve as a research assistant on the WhatEvery1Says project (WE1S) from 2018 to 2020. The project used digital humanities methods to study media discourse about the humanities through large corpora of varying authorship:
The project concentrates on, but is not limited to, journalistic articles in the U.S. available in digital textual form beginning circa 1981. Other materials include social media. Our hypothesis is that digital methods can help us learn new things about how the humanities have been portrayed in public discourse. For example, are there sub-themes beneath the familiar dominant clichés and memes? Are there hidden connections or mismatches between the “frames” (premises, metaphors, and narratives) of those arguing for and against the humanities? Where do the humanities fit among other topics in public discussion? How do different sources (for example, mainstream versus student newspapers) or different parts of the nation or world compare in the way they talk about the humanities? And in what way—if to any significant degree at all—does the media position racial, ethnic, gender, first-generation student and other social groups in relation to the humanities?
I primarily worked on the Social Groups team, which explored themes related to race, gender, sexuality, and first-generation to college status. I not only worked in the topic models synthesizing results, but I leveraged my experience programming and making maps to create several visualizaions (see below) and explore additional methods, such as word embeddings (vectorized forms of words), to enhance our understanding of word similarity and the significance of who says what “where.” A detailed summary of our results can be found here.
AAG Presentation, 2017
Generating Building Exterior Wall Material Estimates Using Google Street View Imagery
When I was working at Oak Ridge National Laboratory (ORNL), I was tasked with populating and managing a spatial database on global building information. Sometimes we would not have building information for many parts of countries or entire countries, so I decided to explore how we could leverage Google Street View imagery to improve the spatial coverage of our database. This led me to first test out how to use the Google Street View API to obtain oblique (or street level) imagery, scale that to extract thousands of labeled images of buildings based on known addresses and exterior wall material types (leveraging ORNL access to other building databases), and then train a convolutional neural network (CNN) to detect “brick” or “no brick”. I did most of my API calls, labeling and automated file organization in Python. I implemented the CNN architecture LeNet, modified some parameters and ran the model on an ORNL Linux machine. I would have loved to continue this project, but it originally was just for exploration and I left ORNL a few months later to start my PhD program.
Link to the slides from the American Association of Geographers (AAG) 2017 Annual Meeting, where I presented this work, here.
MUSA Capstone, 2015
Using GIS to Support In-Flight Operations in the Event of an Airport Outage
For my master’s of urban spatial analytics degree (MUSA), I had to complete a capstone project, which was like a master’s thesis. My project was titled “Using GIS to Support In-Flight Operations in the Event of an Airport Outage.” My master’s committee included Professors Amy Hillier and Megan Ryerson from the University of Pennsylvania. They were incredible scholars, instructors and mentors. An image of the poster I created based on my paper is below.
This work can be seen in the Esri Map Book, Volume 31: 168-169, Esri Press.